
There is more than one sensible way to do that.
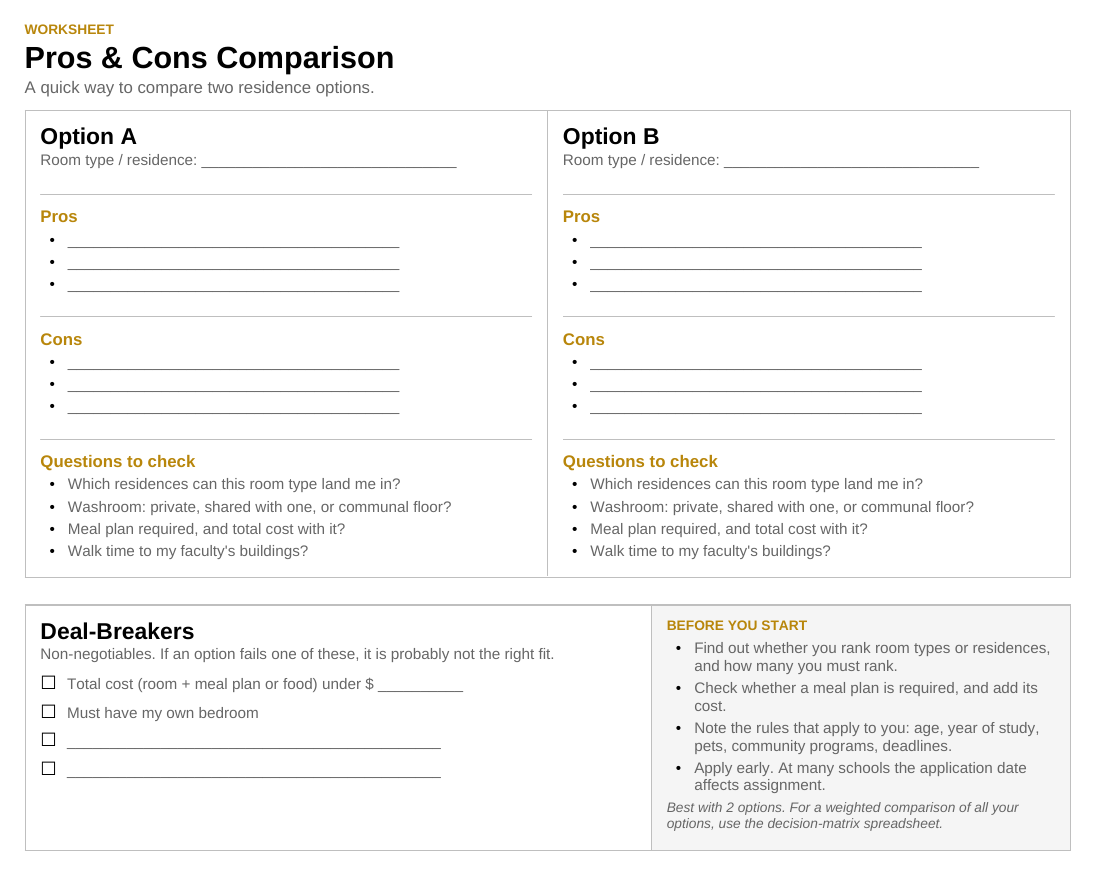
A simple pros-and-cons list can work when you have two choices and only a few things to consider. The worksheet below is a one-page version you can print: two options side by side, the questions worth checking for each, and a place to write down your deal-breakers. Housing decisions often involve many more variables.
You may be comparing several buildings, room types or other housing options across cost, privacy, location, facilities, washroom arrangements, community and other factors.
A weighted decision matrix helps organize that complexity.
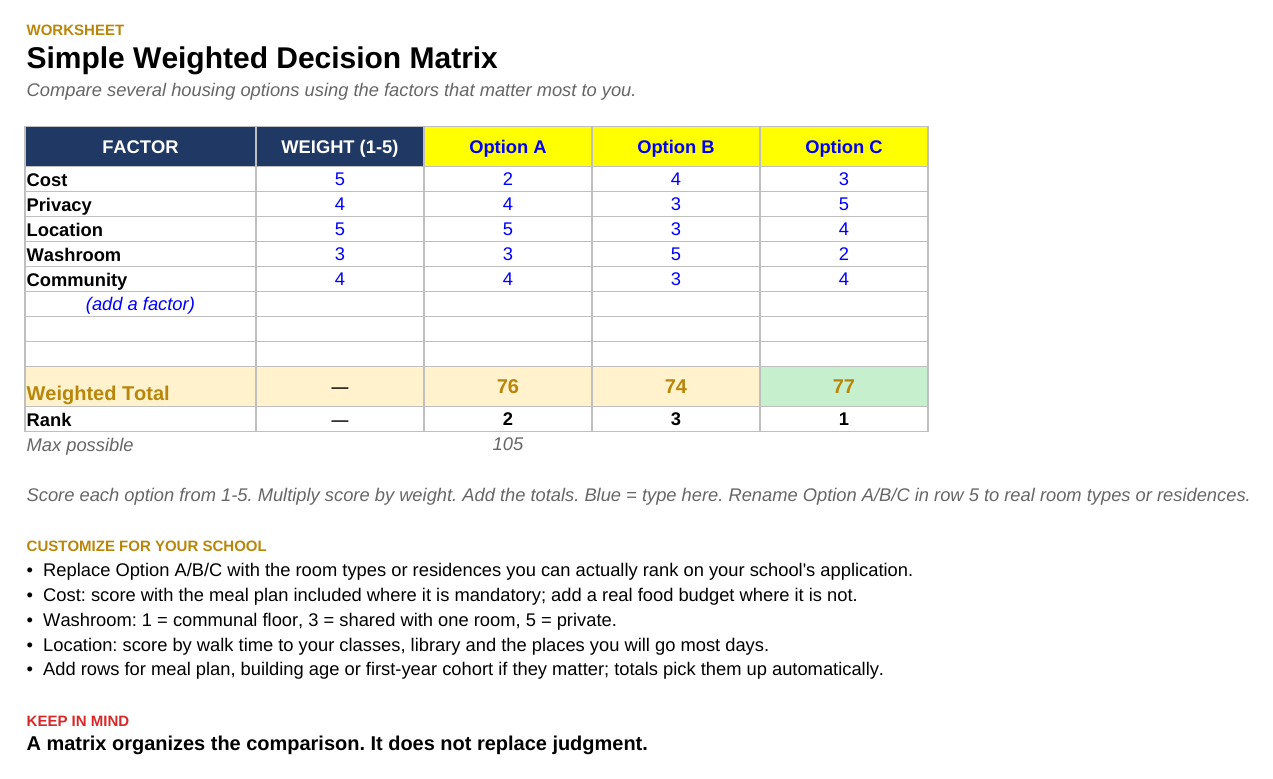
The basic idea is straightforward. Factors that matter more to you receive more influence in the comparison. Each housing option is then considered against those factors.
But the matrix is only one view of the decision.
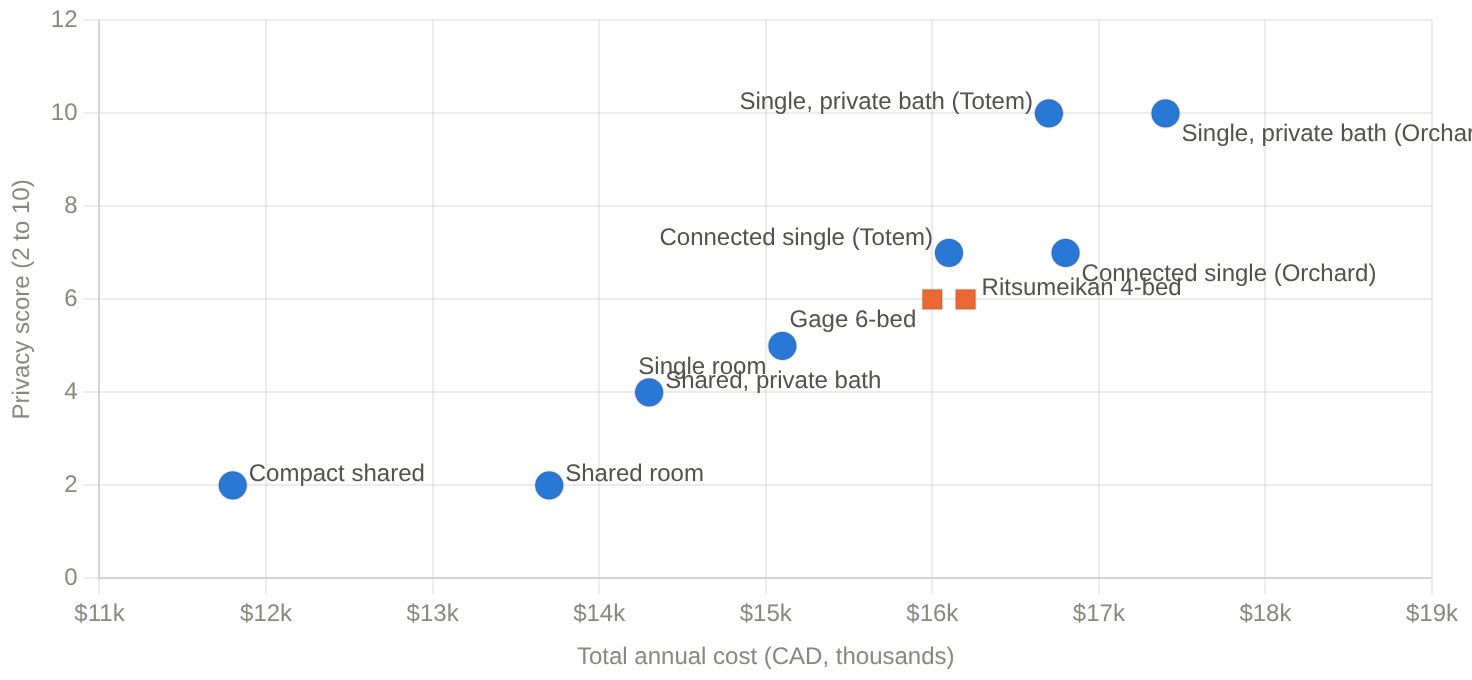
We also want to see the tradeoffs hidden inside the total score. If one option ranks slightly higher than another, what are you actually getting in exchange?
Perhaps you gain privacy but pay more.
Perhaps you save money but accept a location you like less. The map below plots one real set of options by cost against privacy score, so you can see at a glance where the real trade-offs sit: which price jumps buy you noticeably more privacy, and which don't.
Perhaps two options perform very differently but still end up with almost identical overall results.

There are also situations where reducing everything to a single number gives a false impression of certainty. Two options may simply be good in different ways. Methods such as outranking can help us recognize that rather than forcing one of them to appear decisively better.
This is an important principle behind Decidient.
We do not use a method just because we have it.
Different methods answer different questions.
The purpose of comparison is not to manufacture a winner. It is to help you see the differences that matter.
Your Decision Kit brings those comparisons together. You can see which options fit your stated priorities, which ones are close behind and what separates them.
That is far more useful than a list ranked from one to ten with no explanation.
A ranking tells you where the options finished.
Decision support should also tell you why.